Why it matters?

When authors of a study want to make the case that their research is newsworthy, they almost always do so on the basis of their results being ‘statistically significant’. What, however, does this term mean exactly? Does statistical significance mean significance for news editors? Perhaps most importantly, can it be manipulated? In order to report on science in an informed way, we must understand statistical significance.

What is statistical significance?

What makes a scientific study newsworthy? Often, a press release will report the results of a study as being ‘statistically significant’. Statistical significance is one of the key concepts for analysing data. What, however, does statistical significance mean exactly, and what does it really show?

Statistical significance is easy to get a general gist of, but slightly more difficult to fully understand. It is also easy to be misled by it if we don’t know what we are looking for. It is also a concept which can be misused. For journalists writing about scientific concepts, it is therefore essential to get it right.

We say a result is statistically significant if it was very unlikely to come about unless the hypothesis we are testing is true. This is simple enough, but what exactly is a hypothesis? What does “very unlikely” mean here? And how do we go about conducting this test in the first place?

In order to understand statistical significance we first need to answer these questions and to understand what is involved in statistical testing more broadly.

What is a hypothesis?

In statistics, a hypothesis is the scientist’s initial belief about a situation before a study takes place. For example, a scientist believes that a high concentration of toothpaste factories in the local area has led to a build up of the chemical titanium dioxide in local waterway. Her hypothesis, therefore, is that the level of titanium dioxide in the river is higher than the national average.

She takes a sample from a local river and observes a level of titanium dioxide that is above the national average. How can she be sure, however, that the level really is higher than national average, and that the sample she took was not higher just by chance?

If she knows what the average national level is, and how much deviation there is from this level on average (called in statistics the ‘standard deviation’) then she can calculate how likely she would be to get this sample if there is no difference from the national average.

In other words, if she assumes that the local river has the national average level of titanium dioxide, what is the likelihood of her finding the sample she did? In statistics this hypothesis, that the level in the river is equal to the national average, is called the ‘null hypothesis’, or the hypothesis of no effect.

If she finds that it is very unlikely that the null hypothesis is true, that is, if she finds it to be very unlikely to get the sample she did if the river did not contain above-average levels of titanium dioxide, then she ‘rejects’ the null hypothesis.

What is a p-value?

How do we define the likelihood of finding a particular sample, and what does ‘very unlikely’ mean here? To answer these questions, we use something called a ‘p-value’.

A p-value is the probability of observing results at least as extreme as those measured when the null hypothesis is true. In the case of our scientist, the p-value is the probability of her finding the sample she did, containing higher levels of titanium dioxide, if the level in the river is no higher than the national average.

For instance, a p-value of 0.1 means that there is a 10% chance of finding the sample she did if the level in the river is no higher than the national average. Likewise, a p-value of 0.001 means there is only a 0.1%, or 1 in 1000 chance of finding the sample she did.

A very low p-value is, therefore, evidence that the null hypothesis is not true. If the scientist gets a very low p-value then she has a strong reason to believe that the level of titanium dioxide in the local river is higher than the national average.
How low does a p-value have to be in order to reject the null hypothesis? This is where we come back to the idea of statistical significance. Statistical significance is defined in terms of the p-value. A result, for example, that is statistically significant at the 5% level means that it has a p-value that is below 0.05.

Statistical significance is generally defined at the 5% or 1% levels (p-value below 0.05 or below 0.01), and this is what ‘statistically significant’ in a press release will often mean.

Sample size, distribution, causation

This post has provided a basic outline of what is involved in statistical testing. While it leaves a lot out, some of the missing elements should be clear. For example, we said the scientist takes ‘a sample’ of the water from the lake. In reality, however, no scientist would base a study on a single sample – any result could just be a random fluctuation in that sample.

Instead, studies are based on hundreds if not thousands of individual samples. In general the more samples we take the more accurate we can be, as we are cutting down the potential for random sampling errors. How large a sample, however, do we need? This depends on the type of study and the type of tests we are performing, among other things.

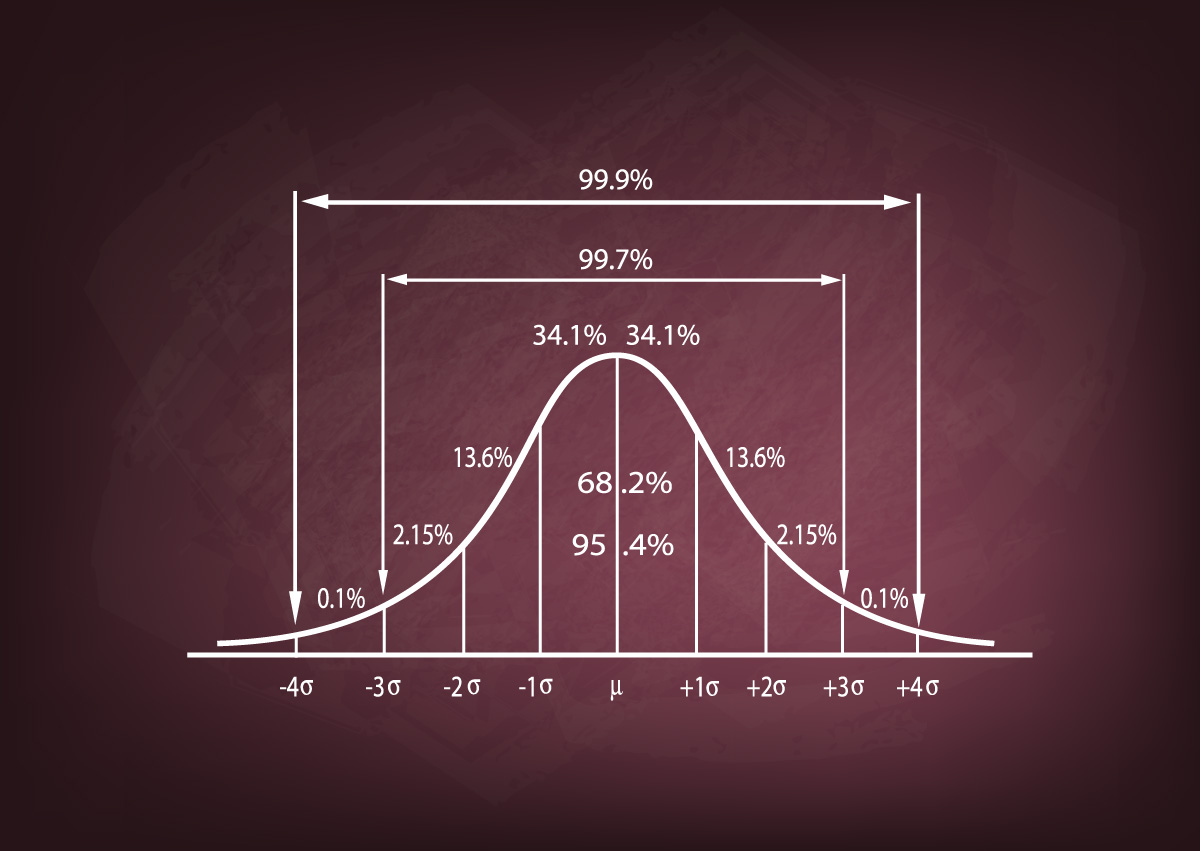
We also did not discuss the distribution of the population introduced the idea of the ‘national average’. In this example we assumed that the population is evenly distributed around the average, that is ‘normally distributed’, which means that if plot it in a graph it will have the classic ‘bell-curve’ shape. In reality, this can be problematic, particularly if we are dealing with a population with a number of outliers.

Consider a classic example of something that does not follow a normal distribution: income. The top 10% of earners earn more than the bottom 50%, so the average income level will be more than what most people make. This is an example of a ‘skewed’ distribution, which affects what we can infer from the data.

Finally, there is the question of what we can actually infer from a statistically significant result. We said that the scientist set out believing that the presence of a toothpaste factory has led to higher titanium dioxide level in the river. Suppose the results of her test are statistically significant. In this case she rejects the null hypothesis, i.e. she rules out the amount of titanium dioxide in the river being equal to the national average.

This is NOT the same as proving her initial suspicions. This is a very important point. Rejecting the null hypothesis in a statistical test does not mean endorsing the truth of the hypothesis being put forward. A statistical test also tells us absolutely nothing about what is causing the observed effect.

Climate Change

Glossary of common statistical terms

Scientists, unfortunately, are not always the clearest communicators. Often press releases are filled with jargon, with the results of studies being reported in terms of abstract statistical concepts. Without the benefit of specialised statistical training it can be difficult to see through the haze of means, modes and medians. Understanding what these terms mean is crucial if we are to write about science in a way that is accessible to the general public.

Average: An ambiguous term. It usually denotes the mean, but it may also be used to denote the median, mode, or weighted mean, among others. Beware if a press release reports “the average” without making it clear which average.

Confidence Level: This refers to the percentage of all possible samples that can be expected to include the true population parameter. For example, a 95% confidence level implies that 95% of the confidence intervals would include the true population parameter.

Margin of error: A somewhat fuzzy term, the margin of error is a measure of uncertainty in an estimate.

Mean: The sum of a list of numbers divided by how many numbers are in the list. The mean of (3,4,5), for example, is the sum (12) divided by the number of elements (3). This produces a mean of 4.

Median: The middle value in a list of numbers. In the list (14, 30, 31, 60, 100), for example, the median is 31.

Mode: The number that appears most often in a list. For example, in a study of five participants aged 17, 20, 20, 22 and 24, the modal age is 20.

Normal distribution: A probability distribution which is illustrated by a bell-shaped curve, is symmetrical, and has standard probabilities for data x standard deviations away from the mean.

Percentage and percentage change: Percentage is a fraction of a whole, for example: if 60 out of 100 people have cars, 60% of people have cars. Percentage change is the difference between the new number and the old number divided by the old number, for example: if this year 70 out of 100 people have cars, the percentage increase this year would be 70-60=10, 10/60 = 16.6% increase.

Null Hypothesis: The generally accepted idea before hypothesis testing occurs. It is against this that an experiment test an alternative hypothesis.

Outlier: An outlier is a data point that is a considerable distance from the next nearest data point, or that is many standard deviations from the mean. An outlier can be an indication of spurious data, in which case it can be discarded. However, care must be taken as it may also indicate the true variability of the measurement process.

P-Value: This is a way of determining if the null hypothesis is correct. In technical terms, it shows the probability of observing results at least as extreme as those measured when the null hypothesis is true.  Generally, a small p-value (<=.05) indicates that there is evidence to reject the null hypothesis.

Population: The entire collection of whatever units are being studied. Samples will be small segments of this population.

Sample size: The number of elements in a sample from a population. If a study surveys 100 people, for example, or records the size of 100 household products, then the sample size is 100.

Simple random sample (SRS): A sample drawn from a population by a procedure which ensures randomness. In other words, SRS ensures that a group of 100 people drawn from a population has the same probability of being drawn as any other group of 100 people in the population.

Standard deviation: A statistical measure of the distribution of a sample. A large standard deviation implies